Policing and Crime in Ontario, Part 3: statistical relationships

This is the third post in a blog series examining crime and policing in Ontario.
Crime rates and severity, as well as policing resources per person, can differ substantially across Ontario municipalities. Naturally, Ontarians want to know the relationship between crime and police resources, particularly when police forces are asking for more money.
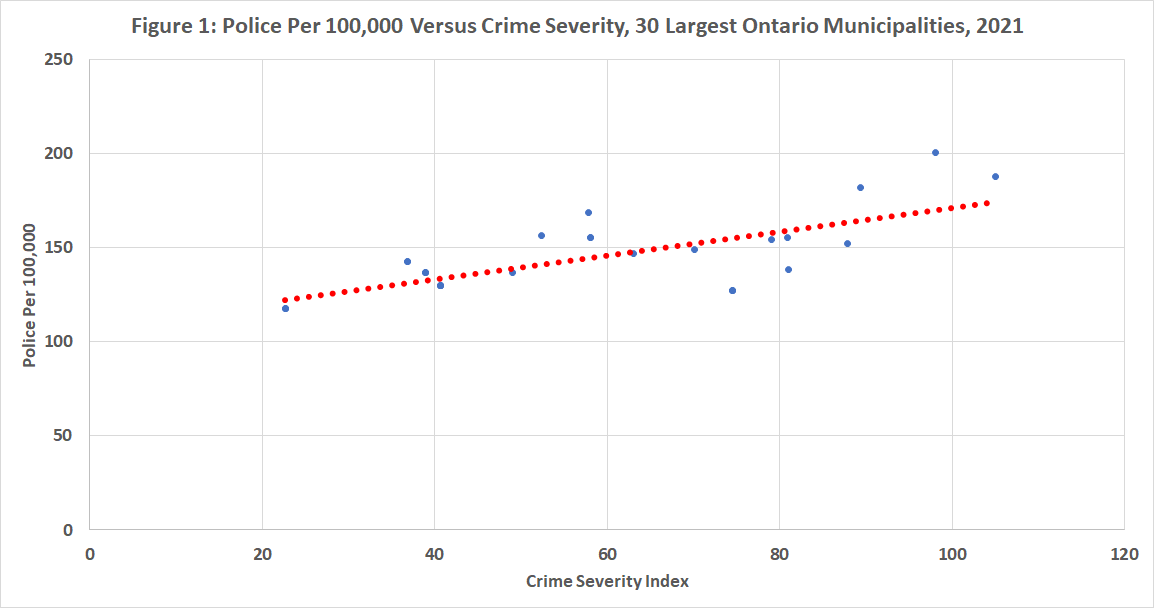
The first chart below plots the number of police officers per 100,000 against the Crime Severity Index (CSI) in Ontario’s 30 largest municipalities. As illustrated, there’s a positive relationship between crime severity and police levels, which some might find counterintuitive as one would think that more police means less crime. However, as has been noted, it’s sometimes difficult to sort out if more police officers result in less crime or whether more crime leads to a call for more police resources and an increase in police officers. Or even if more officers and more crime are positively related because of more effective reporting and control of crime.
While one could interpret this as evidence that more crime requires more police, it remains that we must account for the aforementioned bidirectional nature of the relationship and this ultimately requires controlling for confounding factors before attempting to answer the question as to whether the crime severity in these communities supports the policing numbers.
The table below presents regression estimates of the determinants of crime severity and policing using data for the 30 largest Ontario municipalities in 2021 and with a methodology similar to other studies. The regression models first estimate a regression of the CSI on police officers per 100,000, average household income in the municipality, and regional variables placing the municipalities in either Northern, Eastern, Western, Central/GTA or the Niagara Peninsula (with Central/GTA as the omitted regional comparison variable). Northern municipalities are Thunder Bay and Sudbury. Eastern municipalities are Ottawa and Kingston. Western municipalities include London, Windsor and Chatham-Kent. The Niagara peninsula includes Hamilton, St. Catharines and Niagara Falls. The remainder are in the Central/GTA region.
| Independent Variables | Dependent Variables | |||
|---|---|---|---|---|
| Crime Severity Index | Police Per 100,000 | |||
| Coefficient | t-statistic** | Coefficient | t-statistics | |
| Crime Severity Index (Fitted) | 1.2243 | 5.77 | ||
| Police Per 100,000 | 0.3303 | 2.58 | ||
| Average Residential Property Taxes (Bungalow) | 0.0027 | 1.12 | ||
| Average Household Income | -0.0003 | -2.25 | ||
| Population Denisty (Pop per sq km) | 0.0047 | 3.23 | ||
| North | 29.7037 | 2.37 | -13.8795 | -0.96 |
| East | 6.0307 | 0.94 | -0.8435 | -0.14 |
| West | 26.0664 | 2.97 | -29.0865 | -2.61 |
| Niagara Peninsula | 9.5663 | 1.19 | -7.4826 | -0.93 |
| Constant | 39.4255 | 1.26 | 61.8264 | 3.93 |
| n | 30 | 30 | ||
| F-statistics | 10.22 | 21.53 | ||
| r-squared | 0.73 | 0.87 | ||
*Regression estimated using OLS and weighted regression and STATA 17.0 **italics denote significant at 5% level.
To account for bidirectional or simultaneous effects, this regression was used to estimate a fitted CSI from the estimated coefficients, and it was then used in the police officers per 100,000 regression as the crime variable. The remaining determinants in the police regression were average residential property taxes for a three-bedroom bungalow as a measure of potential community resources, population density (persons per square kilometre), and then again, the set of regional variables, which are included to capture regional differences that might uniquely affect not only crime rates and severity but also the operation of police services. For example, Indigenous peoples comprise a larger population share of Northern Ontario and according to self-reported information from the 2009 General Social survey (GSS), aboriginal people were two times more likely than non-aboriginal people to experience violent victimization such as an assault, sexual assault or robbery (232 versus 114 incidents per 1,000 population). The approach is essentially a simultaneous equations technique and also uses weighted regression where observations were weighted by municipal population size thereby providing greater weight to larger population size municipalities.
The results show that variables significantly affecting crime severity positively include police officers per 100,000 population and the regional variable with Northern and Western Ontario demonstrating higher crime rates relative to the Central/GTA municipalities. As well, crime severity is negatively and significantly related to average household incomes in the municipality. Crime severity is also positively and significantly related to police officers per 100,000, which can be interpreted either as having more police officers per person results in more crime being reported and dealt with, or more crime requires more police officers.
In the police determinants regression, police officers per 100,000 is positively and significantly related to crime severity (fitted) and population density. The only regional variable that’s significant here is Western Ontario and that variable shows that Western Ontario has fewer police officers per 100,000 in relation to the Central/GTA region, all other things given. Both regressions explain a high proportion of the variation in the dependent variables.
Having established a statistical relationship between policing resources and crime rates after accounting for a number of confounding factors, the next step (in the fourth and final post of this blog series) is to use these results to see what predicted police staffing levels are like and how they compare to actual levels.


