Wartime presidents added most to U.S. federal debt-to-GDP ratio

The total federal debt of the United States has grown steeply in recent years and now stands at almost $22 trillion or about 107 per cent of GDP. While it’s tempting to conclude that the buck always stops with a sitting president, every president inherits a stock of debt—then either adds to it or reduces it. In other words, with budgets, every president must play the fiscal hand they’ve been dealt.
Subsequently, to judge a president’s success in dealing with federal debt, we must at minimum look at the size of the debt at the start of his term of office and compare it to how it stands when he left. However, given population growth, inflation and the growth of the economy, a better comparison is looking at the size of the debt relative to the economy—the average size of the federal debt-to-GDP ratio during the presidential term or the debt-to-GDP ratios at the start and the end of each term.
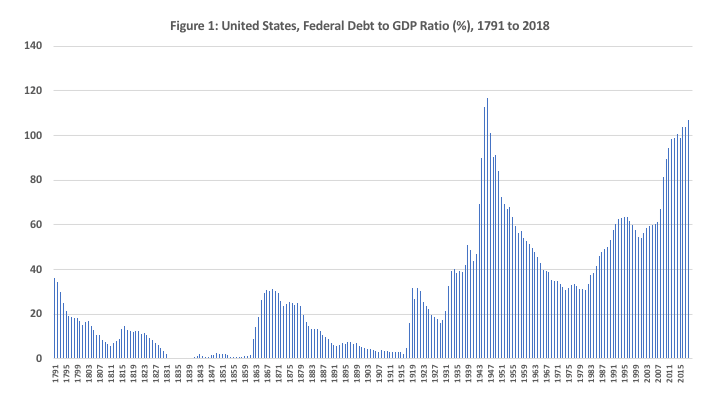
The data resources for this analysis come from EH.NET and FRED. The first chart below plots the gross U.S. federal debt as a per cent of GDP from 1791 to 2018.

In 1791, George Washington had a federal debt-to-GDP ratio of 36 per cent and it fell steadily across successive presidents—with a brief surge during the War of 1812—reaching zero during the mid-1830s. The only president associated with reducing the federal debt-to-GDP ratio to zero is Andrew Jackson (1829-1837). After Jackson, debt started growing but the ratio stayed below two per cent until 1861 when it started to rise due largely to the U.S. Civil War.
By the end of Abraham Lincoln’s term (1861-1865) and the end of the Civil War, the ratio reached 26 per cent and continued rising peaking at 31 per cent under Andrew Johnson (1865-1869) in 1869. It then started another decline during the industrialization and great globalisation of the late-19th century reaching a low of 2.4 per cent in 1916.
As America entered the First World War in 1917, the debt-to-GDP ratio again rose sharply and began a largely uninterrupted rise (despite a break during the roaring 1920s) that peaked at 117 per cent in 1946 in the wake the Great Depression and the Second World War. With the post-war boom, the ratio fell steadily, bottoming out in early-1980s with a low point reached in 1981 at 30.7 per cent.
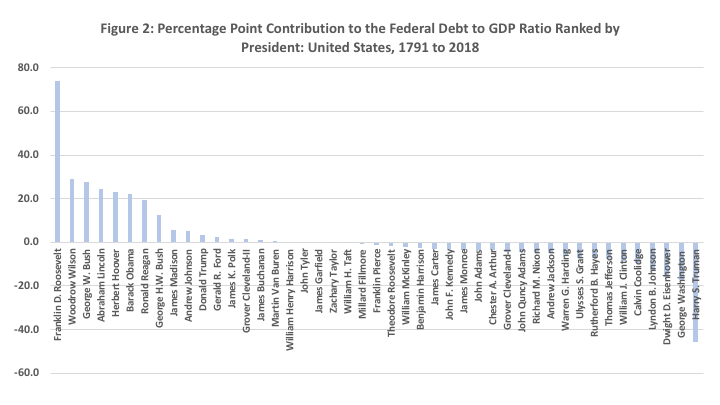
Growth of the debt-to-GDP ratio then resumed with a brief hiatus during the late 1990s and early-21st century and continued onwards and upwards to the present reaching an estimated 107 per cent at the end of 2018. (The second chart below uses the percentage point change in the federal debt-to-GDP ratio during a presidential term to rank each president.)

So, comparing each president at the start and end of their term, what’s their percentage point contribution to the federal debt-to-GDP ratio?
Not surprisingly, wartime presidents added the most to the federal debt-to-GDP ratio. Franklin D. Roosevelt, who also presided over much of the Great Depression, tops the list going from 39.1 per cent in 1933 to 112.9 per cent in 1945 for a positive contribution of 73.8 percentage points. Second is Woodrow Wilson who started his term in 1913 at three per cent and finished in 1921 at 31.8 per cent for an addition of 28.8 percentage points. Close behind in third place is George W. Bush who began his term in 2001 at 54 per cent and ended in 2009 at 81.5 per cent, for an increase of 27.5 points.
After George W. Bush comes Abraham Lincoln at 24.3 percentage points, then Herbert Hoover at 23.1 percentage points and Barack Obama who brought the debt-to-GDP ratio from 81.5 per cent to 103.6 per cent for a contribution of 22.1 percentage points. Rounding out the top 10 are Ronald Reagan (19.6), George H.W. Bush (12.4), James Madison (who fought the War of 1812, 5.5 points) and finally post-Civil War Andrew Johnson (5.1).
Of the 45 presidents, 16 are associated with an increase in the ratio while the remainder either kept it constant or reduced it. Grover Cleveland managed to do both, serving two separate terms, he reduced it by 4.4 percentage points during his first term (1885-1889) and increased it by 1.4 points during his second term (1893-1897). The biggest reductions in the ratio occur under Calvin Coolidge (1923-1929) who saw it fall by 9.4 points, Lyndon Johnson (1963-1969) with a drop of 12.5 percentage points, Dwight Eisenhower (1953-1961) with a drop of 15.8 points, George Washington (1789-1797) with a 17.5 percent point drop and Harry Truman (1945-1953) who saw the greatest reduction of them all, from 112.9 per cent to 67.1 per cent—a 45.8 percentage point drop.
Needless to say, when it comes to public debt, as in much of life, timing is very important. Presidents such as Coolidge, Truman, Eisenhower and Lyndon Johnson, who had the good fortune to serve during booming economies, had their fiscal performance greatly assisted while those with the misfortune of serving during war or depression had a much tougher time. Still, timing is not everything.
Take George Washington who as the first U.S. president faced the economic turmoil of creating a new country and inherited the revolutionary debt, yet managed the second largest percentage point reduction in the federal debt-to-GDP ratio. And despite a booming economy, Donald Trump has managed in the first two years of his term to raise the ratio from 103.6 per cent to 107.1 per cent—an increase of 3.5 points—putting him in the top third of this ranking with two years to go.

